This blog post was written by Felicity Fan.
Partner: Deep Canvassing Nederland
Team: 2 Data Enthusiasts, 1 Project Lead
Topic: Analysing deep canvassing survey data
Skills: Python, Streamlit, Pandas, GeoPandas, Git, Data Visualisation
Project start: January 2026
Project end: July 2026
Place: Remote
Project goals: Evaluate the impact of the deep canvassing campaign on immigration attitudes, understand what drives impact, and build an interactive dashboard to make ongoing insights accessible to the organisation.
What is Deep Canvassing Nederland?
Deep canvassing is a conversation method where trained volunteers knock on doors and have genuine, empathy-driven conversations with strangers about socially divisive topics. Unlike traditional political canvassing, deep canvassing is not about delivering a message — it is about listening, sharing personal stories, and creating space for people to reflect on their own views. It is one of the few persuasion methods that has been scientifically shown to produce durable attitude change.
Deep Canvassing Nederland is a Dutch organisation founded in 2023 with a mission to bring this method to the Netherlands. For the past two years, around a hundred volunteers have been knocking on doors across the country to have 15–20 minute conversations about immigration — one of the most divisive topics in Dutch public life. Every conversation is logged in a custom-built web app, designed with European privacy law in mind so that no single conversation can be traced back to an individual address or volunteer.
Deep Canvassing Nederland × CorrelAid Netherlands
By early 2026, Deep Canvassing Nederland had built up a rich dataset of thousands of door knocks and conversations — and wanted to understand what it was telling them. That is where CorrelAid Netherlands came in.
Our team of three volunteer data analysts joined forces with the organisation to do three things: evaluate whether the campaign was having a measurable impact on immigration attitudes, understand what factors were associated with the most successful conversations, and build tools that would make these insights available to the organisation on an ongoing basis.
The project ran from January to July 2026, and resulted in two key deliverables: an interactive Streamlit dashboard and a comprehensive analysis report.
The Data
Each time a volunteer has a conversation, they record a range of information: where the conversation took place, how many canvassers were present, and crucially — how the participant rated their own attitude on two key statements about immigration, both before and after the conversation, on a scale from 1 to 10. The first statement is a near-consensus one about housing, education, work and care for everyone in the Netherlands, and it doubles as a control: almost everyone already agrees with it, and that agreement holds steady after the conversation. The second, more contentious statement is specifically about migrants — and it is this one that deep canvassing is designed to shift.
This before-and-after design is at the heart of what makes deep canvassing measurable. It allows the organisation to go beyond asking “did people seem receptive?” and instead ask: “did attitudes actually shift?”
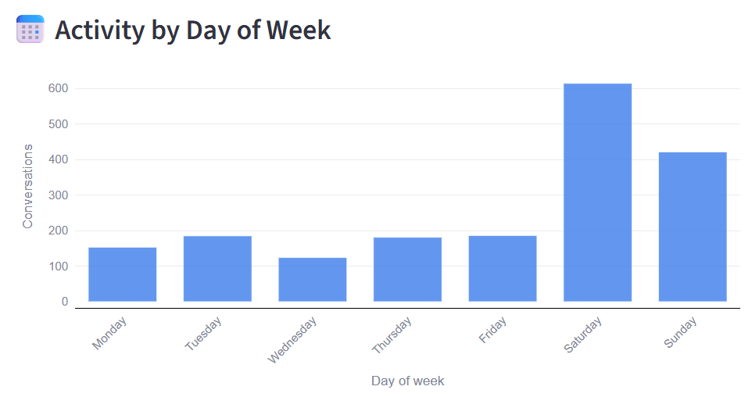
Over the course of the campaign, volunteers logged activity across eleven regions of the Netherlands, with conversations taking place on every day of the week — though, as you might expect for a volunteer-driven effort, Saturdays were by far the busiest.
What We Built
An Interactive Dashboard
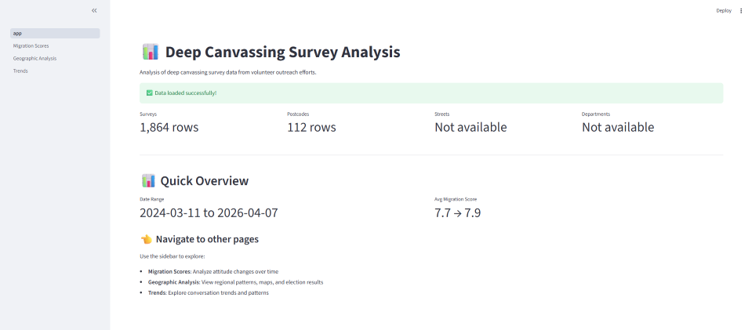
The centrepiece of the project is a multi-page Streamlit dashboard, built entirely in Python and deployed for internal use by the organisation. It gives the Deep Canvassing Nederland team a live view of their data across three main areas:
- Attitude scores: How immigration attitudes are shifting before and after conversations, and how this has changed over time
- Geographic analysis: Where canvassing is happening across the Netherlands, and how scores vary by region
- Trends: How conversation volumes have grown over time, by day of week and by region
The dashboard is designed to be updated as new data comes in, giving the organisation a tool for ongoing monitoring rather than a one-time snapshot.
An Analysis Report
Alongside the dashboard, we produced a written analysis report covering the full scope of the project: campaign reach, attitude change, geographic patterns, and recommendations for improving data collection and canvassing strategy going forward.
What the Data Showed
Conversations are making a difference
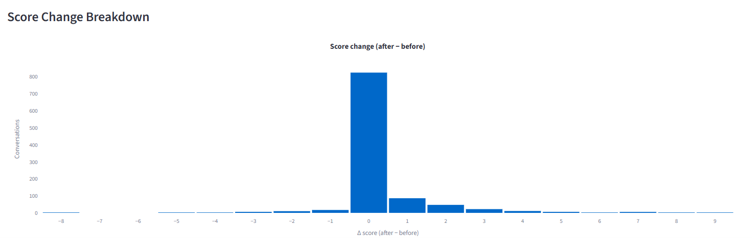
The most important finding from the analysis is also the most encouraging: deep canvassing conversations in the Netherlands are associated with a positive shift in immigration attitudes. 56% of respondents already rated the migration statement 8 or higher before the conversation even started, leaving little room to move further. Among those who did have room to improve, nearly 30% increased their score after the conversation — against only a handful who moved the other way, so upward shifts outnumber downward ones by nearly 5 to 1.
Put differently: conversations are far more likely to shift someone in a positive direction than a negative one. The effect is modest for most individuals — a point or two on a ten-point scale — but it is consistent, and it is in the right direction.
One caveat worth flagging: scores are reported directly to the volunteer conducting the conversation, which may lead some participants to give a more positive answer than they genuinely feel — and we currently have no way to detect or correct for this.
Demography matters
One of the more analytically interesting findings was the relationship between where canvassing takes place and how effective it tends to be. People’s starting attitudes on migration are closely related to how their neighbourhood voted in the 2025 elections: postcodes with a higher share of votes for migration-sceptic parties tend to start with lower migration-attitude scores — and therefore have more room to shift upward. As a result, conversations in more conservative-leaning postcodes resulted in a positive attitude shift 22.6% of the time, compared to only 13.6% in more progressive postcodes — nearly twice the rate.
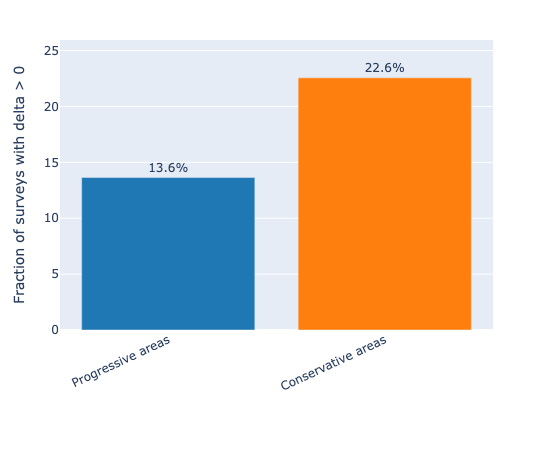
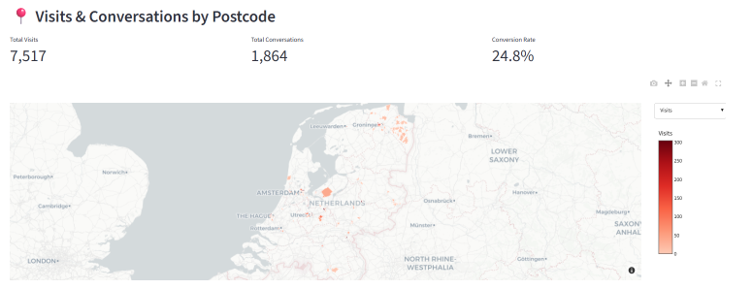
However, most canvassing so far has actually taken place in progressive-leaning postcodes — the areas where people already tend to agree — rather than the conservative-leaning postcodes where a conversation is more likely to change a mind. Redirecting some volunteer effort toward these higher-potential neighbourhoods is one of the clearest available levers to increase the campaign’s overall impact.
Activity has grown — with a visible spike
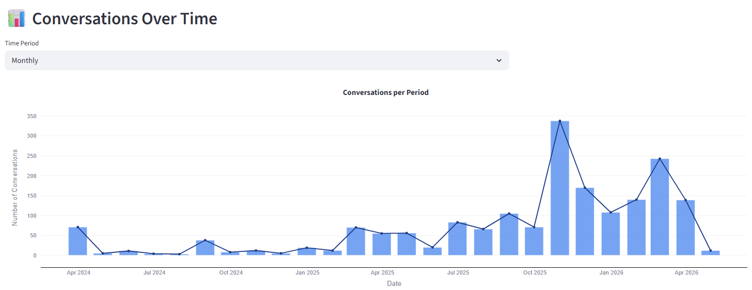
Conversation volumes have grown substantially over the two-year period covered by the dataset: from a handful of conversations per month in 2024 to over 100 per month on average by 2025–26, with a particularly visible spike to more than 300 conversations around the time of the November 2025 Dutch elections, reflecting the heightened motivation of volunteers to engage with the public during a politically significant moment. The volunteer base has grown alongside it: 446 people have signed up so far, of whom 290 have logged at least one conversation.
Looking Ahead
The dashboard is designed to continue beyond this project, giving the organisation the ability to track their own progress over time without relying on external analysts. We have also shared a set of recommendations for how data collection practices could be improved — covering everything from richer volunteer records to follow-up surveys that could help measure whether attitude changes last beyond the day of the conversation.
Conclusion
This project showed what is possible when a small team of volunteer data analysts works closely with a motivated civic organisation. Deep Canvassing Nederland has been doing something remarkable for two years — knocking on doors, having difficult conversations, and quietly trying to shift one of the most entrenched social debates in the Netherlands. The data suggests their efforts are working. Our job was to help them see that clearly, and to give them the tools to keep tracking it.
The volunteer team and CorrelAid Netherlands would like to thank Deep Canvassing Nederland for the inspiring collaboration and for their trust in sharing their data with us. It was a privilege to work on a project with such direct social relevance, and we hope the tools and analysis we have delivered will continue to be useful long after this project has wrapped up.
CorrelAid Netherlands would also like to thank our wonderful volunteers, who dedicate their time and skills to meaningful causes. Thank you for making a difference!
Volunteers: Mehmet Kutluay, Josha van Houdt, Felicity Fan
Deep Canvassing NL: Pippi van Ommen
CorrelAid Netherlands: Alexis Gillett, Fabian Dablander
In case you want to experience our events live, follow announcements of future events on Facebook, or Twitter; sign-up for our newsletter; or become part of CorrelAid Netherlands by filling out this short survey. We’d be delighted to see you at a future event!