This blog post was written by Maria Bader.
Partner Organization: Sensing Clues
Team: 4 Data Enthusiasts, 1 Project Manager, 1 Tech Lead
Topic: Tracking Landscape Vitality in Africa and Europe using Geo-Spatial Data
Skills: R, Python, statistical modeling, visualization, GitHub, Shiny, Geographic Information Systems (GIS) and geospatial data.
Project start: October 2024
Project End: February 2025
Project Goals: Create a Shiny app that tracks vegetation conditions in protected areas using publicly available satellite imagery, enabling local conservation organizations to monitor the vegetation index and take timely action to address environmental concerns.
What is Sensing Clues?
Sensing Clues is a non-profit organization based in the Netherlands, dedicated to global nature conservation through the development of a sophisticated suite of data-driven tools. By integrating real-time data collection, monitoring, and predictive analytics, Sensing Clues supports wildlife rangers, conservationists, and communities in their mission to protect biodiversity and ecosystems. The organization offers hands-on support to its users, making advanced technology accessible to field operators around the world, from Africa to Europe.
Vision:
Sensing Clues envisions a future where the power of data transforms conservation efforts, by enabling more proactive protection of wildlife and natural habitats globally.
Mission:
Sensing Clues’ mission is to provide nature conservation organizations with tools and interdisciplinary workspaces to turn data into actionable information. Our goal is to help professionals make timely, informed decisions that prevent threats to biodiversity and promote the sustainable coexistence of humans and wildlife.
Sensing Clues x Correlaid
The goal of this project was to provide an accessible way for Sensing Clues field partners on the ground to interact with eco basemap layers in order to analyze the local vegetation health. For this the team provided insights for four different conservation areas located in Spain, Zambia, Bulgaria, and Kenya. The team used open source Sentinel-2 satellite images, Python and R, to build an interactive Shiny application that helps field partners monitor the current and historical Normalized Difference Vegetation Index (NDVI), which represents vegetation health. By visualizing vegetation health in an accessible way, the tool enables rangers to make informed, data-driven decisions in their efforts to sustainable landscape management and maintaining their conservation goals.
Geospatial data and NDVI index
NDVI, or Normalized Difference Vegetation Index , is a measure that is colloquially referred to as “greenness index” and represents a way to assess vegetation health. This index is obtained from satellite images, as the difference between how much light is absorbed by plants and how much is reflected. Healthy vegetation absorbs more light in the visible spectrum and reflects more in the near-infrared spectrum. Ranging between 1 and -1, the NDVI provides a numerical value that indicates the health of plants: high values suggest healthy and dense vegetation, moderate values can indicate poor health or cropland, while low values can indicate the absence of vegetation and barren land. This information helps rangers and land managers monitor plant health over time and make informed decisions about land use and management.
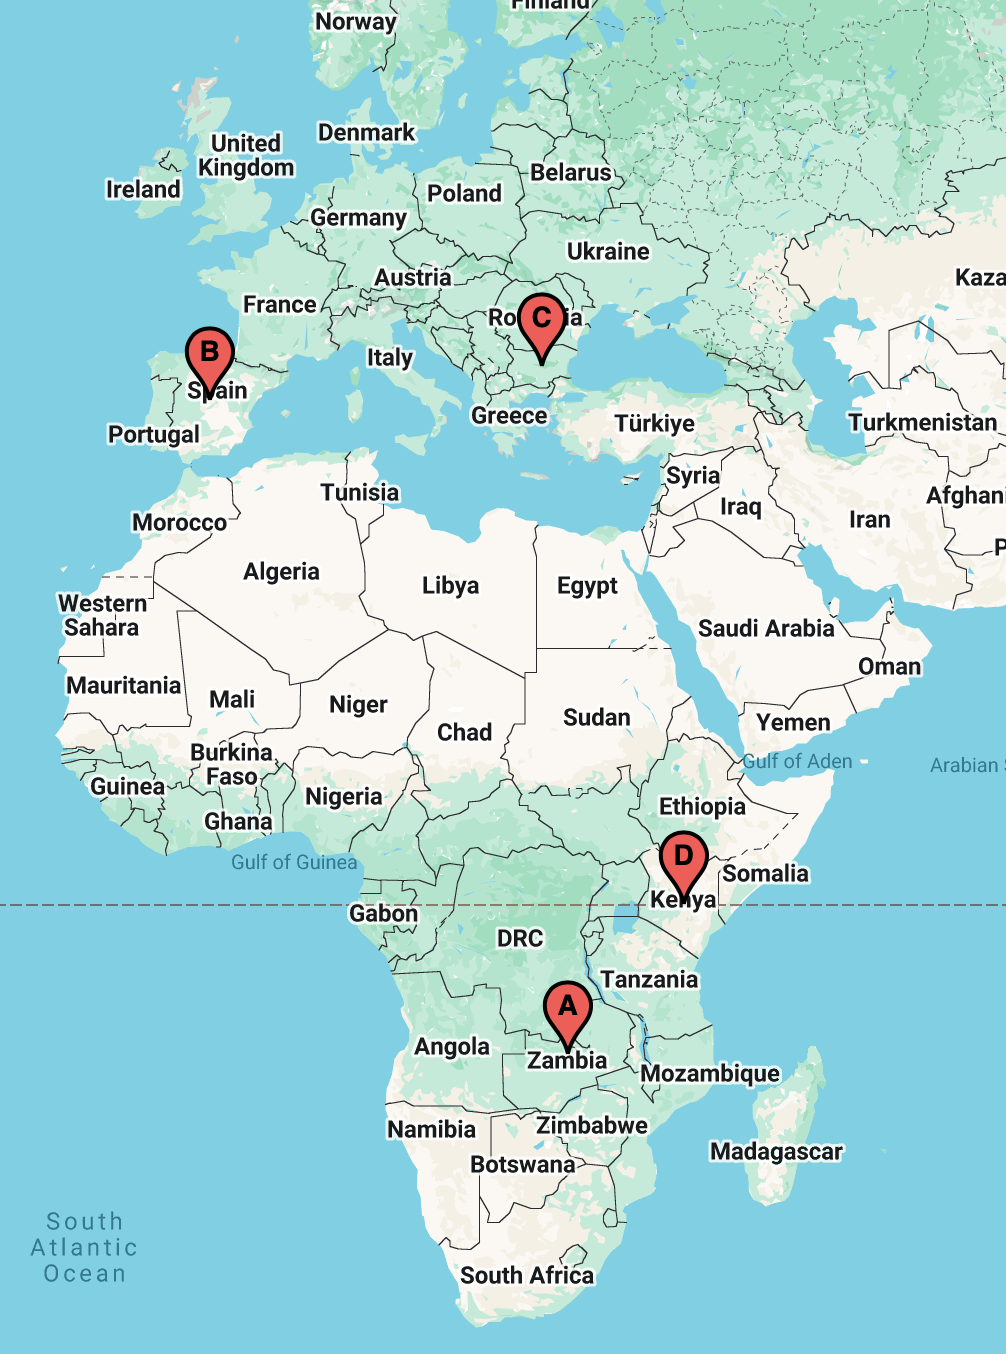
The team used two types of data for the four conservation sites in Zambia (A), Spain (B), Bulgaria (C), and Kenya (D):
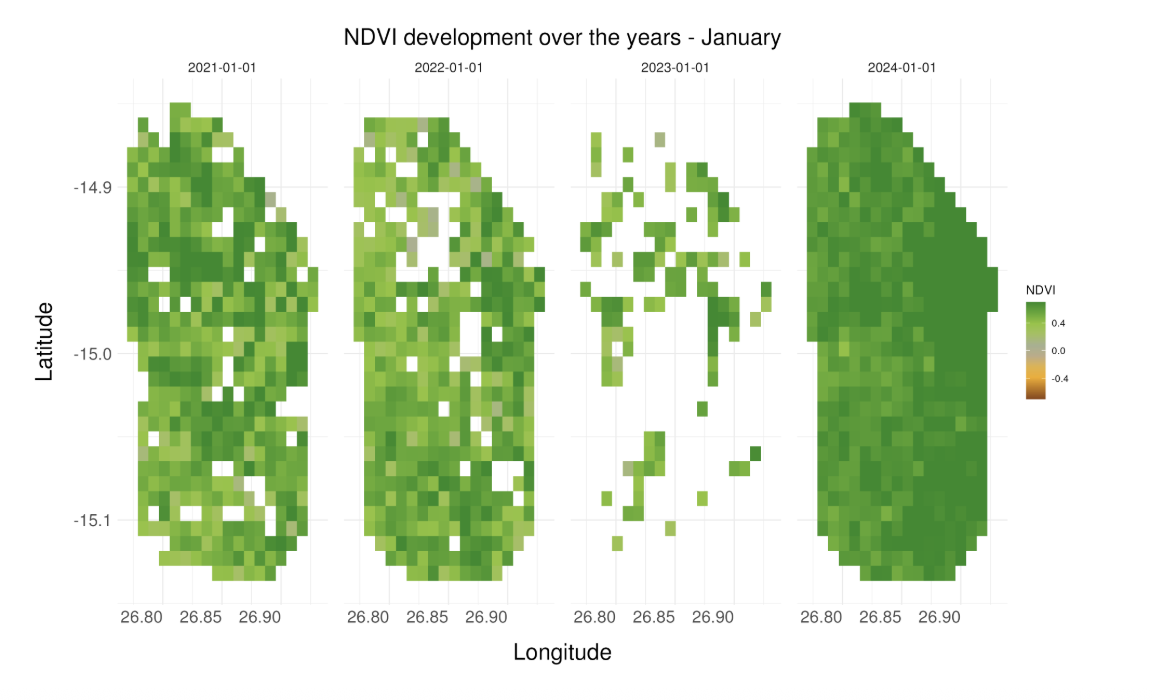
- Sentinel-2 satellite data from the Google Earth Engine to extract the monthly aggregated NDVI data. Images can be affected by clouds, those are excluded to ensure data quality, but can show up as white pixels on the final images.
- Open Source Copernicus Satellite Landcoverage data that allows the division of areas into farmland, water, forest area, and inhabited land. This data is updated annually.
This way, the team was able to identify the current and historical vegetation health at the conservation sites, while also monitoring the impact of land coverage in the respective areas.
Initial analysis: temporal NDVI trends
For each conservation area the team started out with analyzing the historical geospatial NDVI data from periods between 2019 and 2024. This was necessary, since the team did not only want to display the current NDVI, but also understand how it evolved over time. An additional factor of interest here was the seasonality, for example how does the NDVI of January 2024 compare to the NDVI of the previous years?
Since the NDVI seemed to be rather stable, the team decided to further zoom in to capture a more complete picture of how the NDVI evolved over time. The team therefore distilled the monthly NDVI into a time series graph, where the last year’s monthly NDVI can be compared to the monthly average of NDVI of the full conservation area.
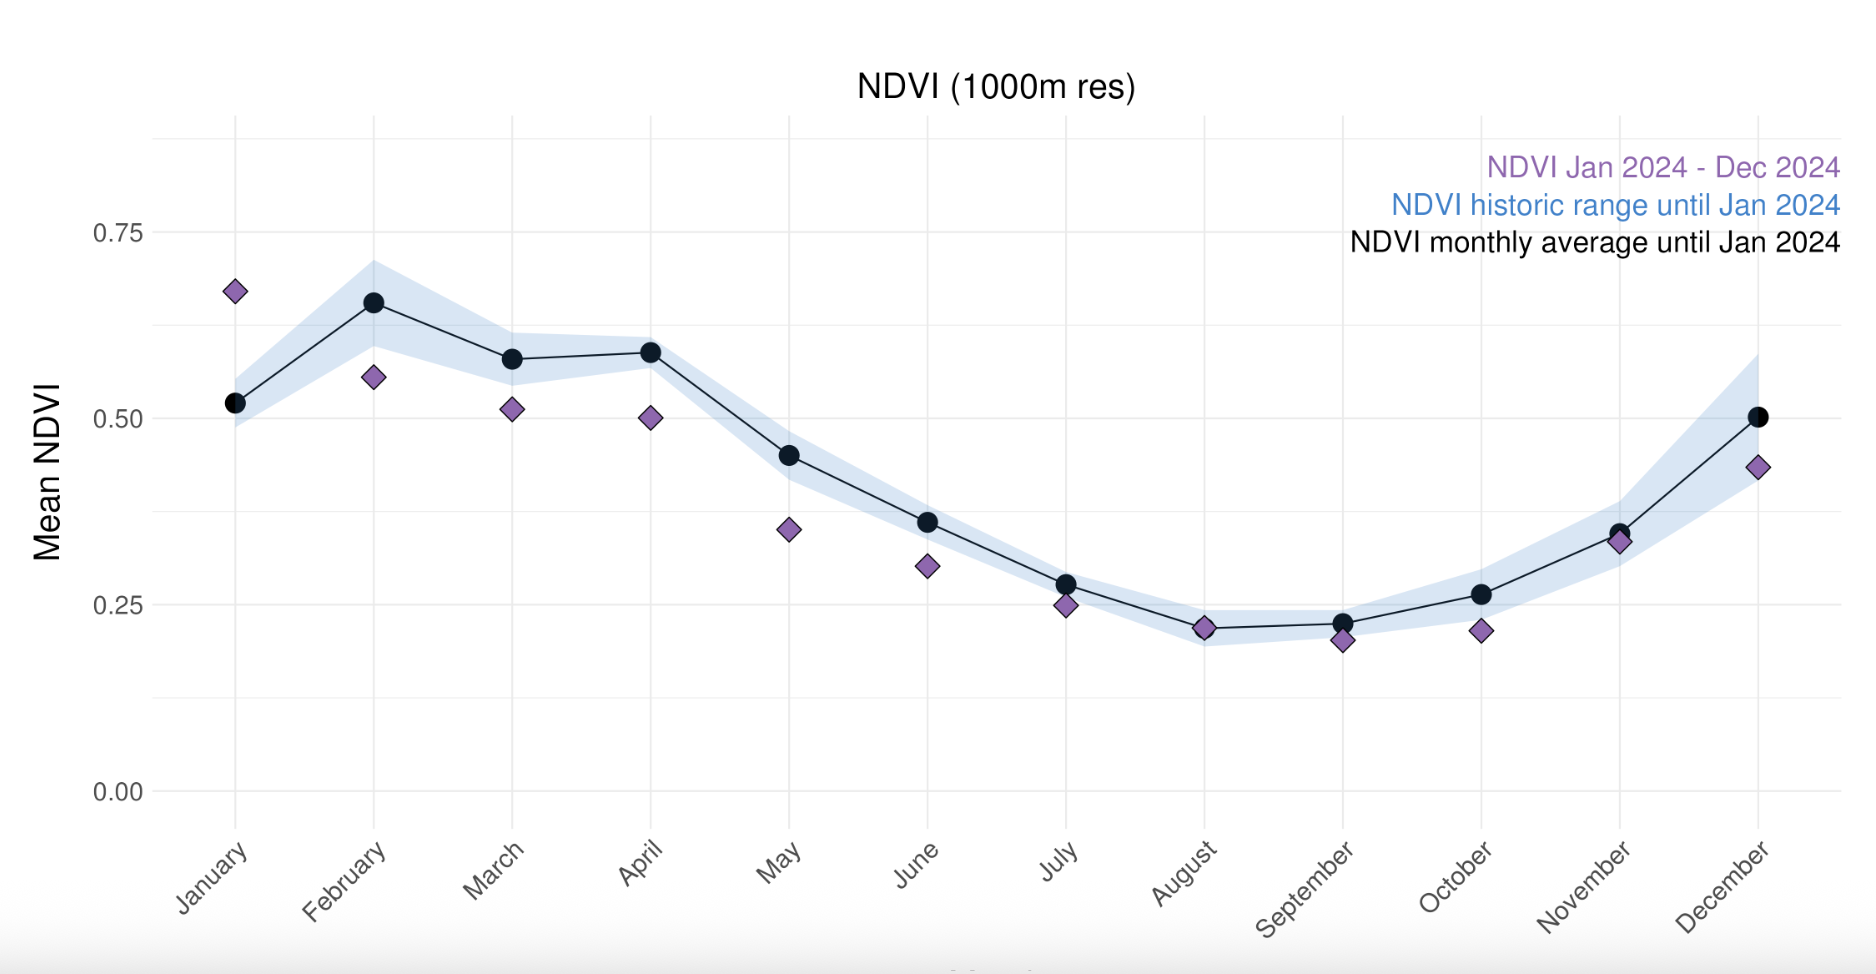
This graph allowed the team to compare recent months (purple) with the average across the past years (black). It became obvious that the NDVI follows an annual pattern, and that in 2024 in the early months of the year, the vegetation healt was much lower than in previous years. This was due to a drought in the area at that time.
Empowering local field partners: Delta NDVI heatmap and land coverage
Next, the team decided to use two types of data to provide local field partners with actionable NDVI insights about their conservation area:
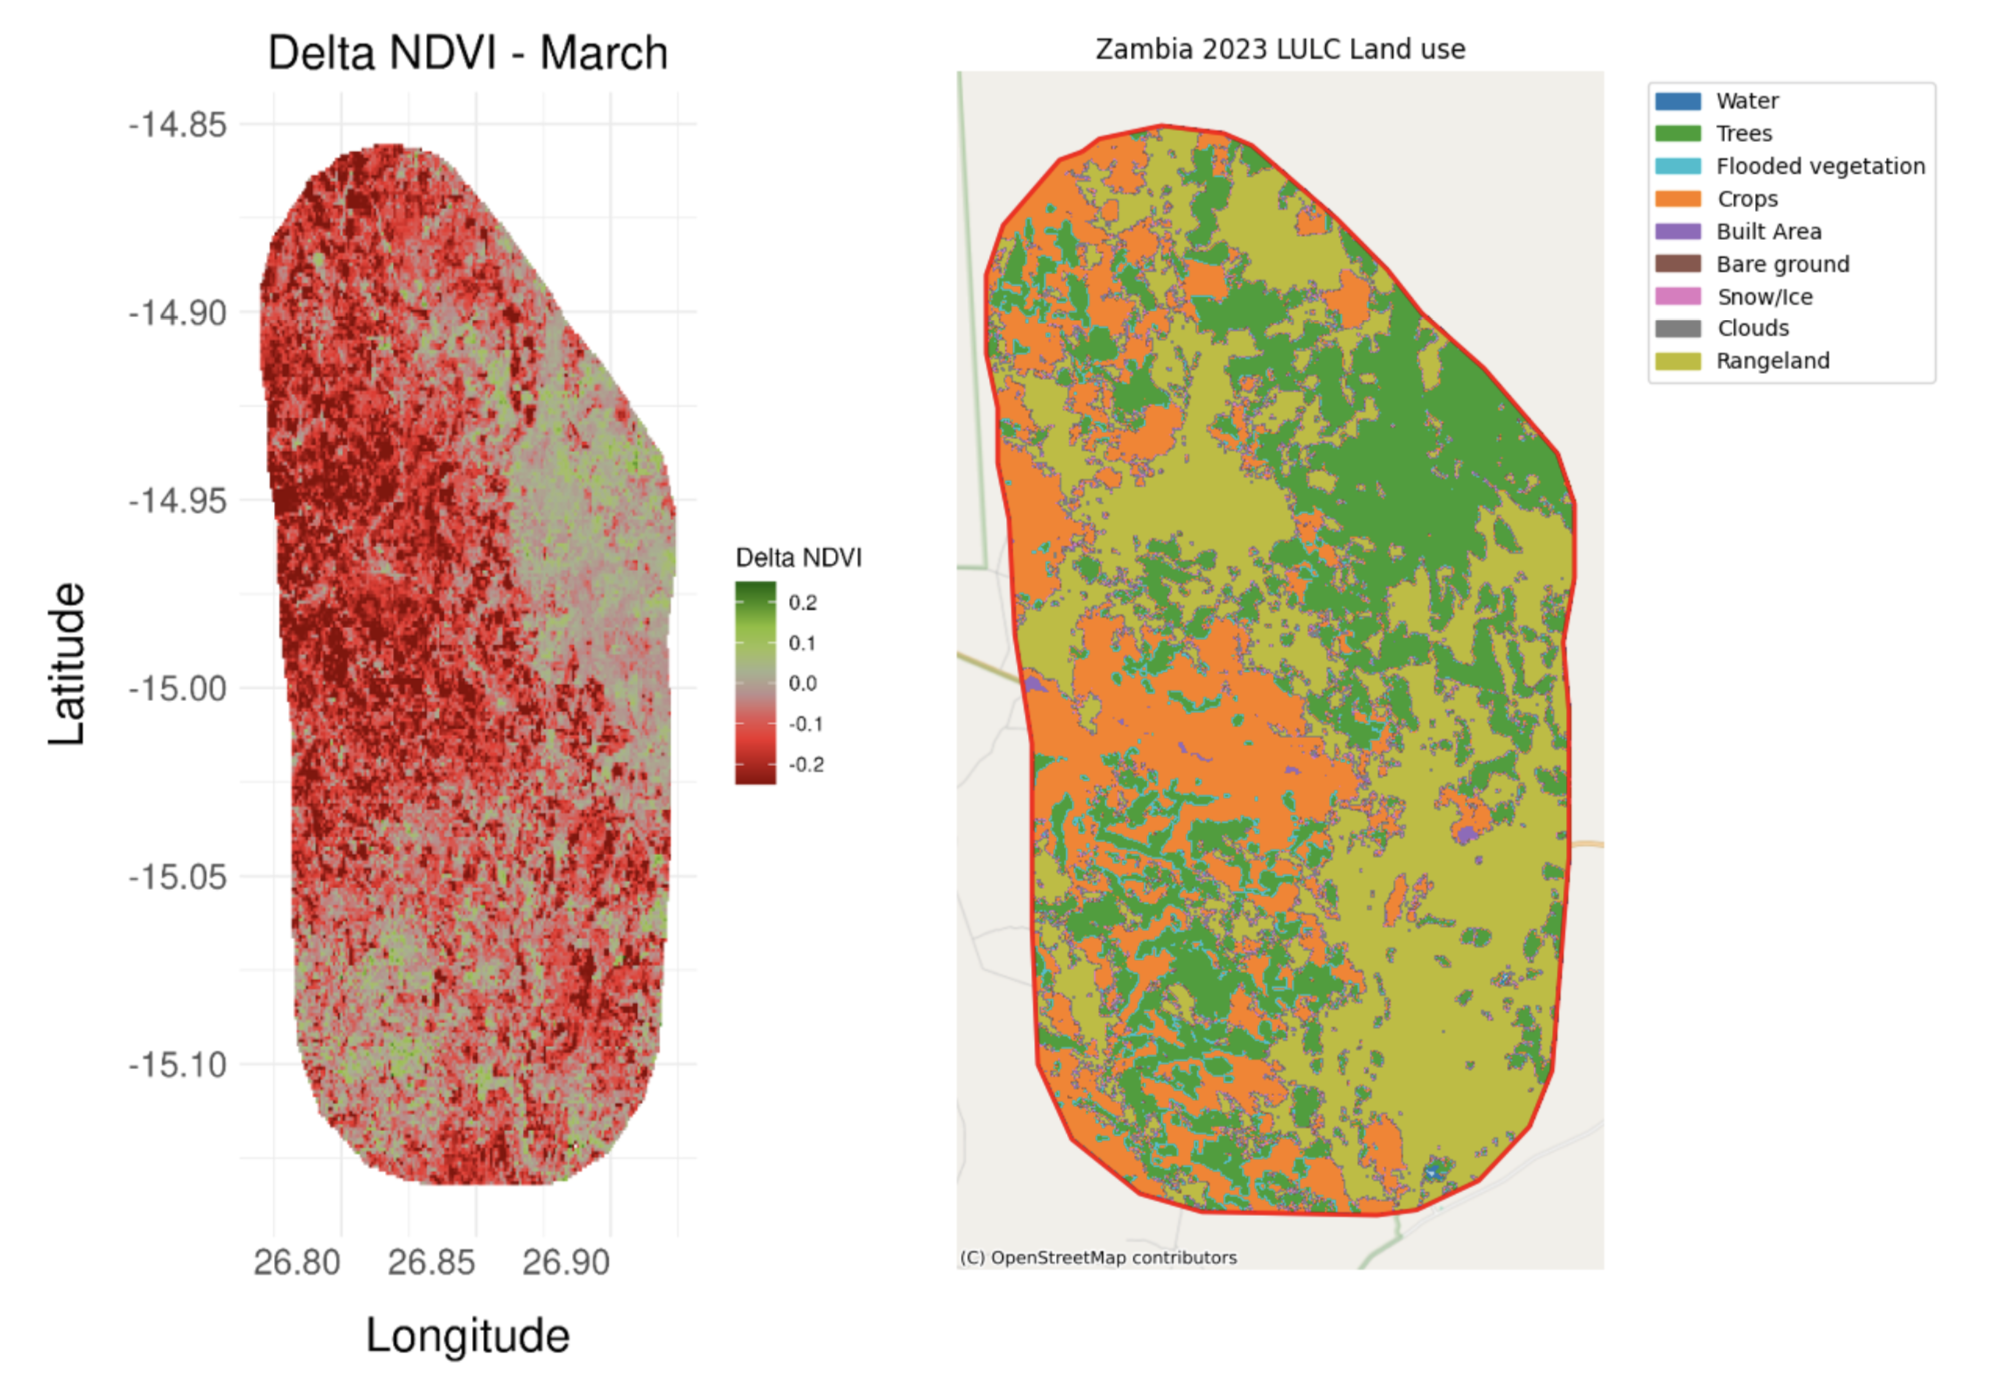
- A “Delta NDVI heatmap” which shows the difference between the NDVI of the current month and the NDVI of the same month in previous years per pixel of the conservation area,
- Land coverage data that shows areas of vegetation, water, crops or built areas.
Using both in combination is a powerful tool to determine which regions are deteriorating in terms of vegetation health faster than expected, and allows field partners on the ground to intervene.
Let’s have a look at Zambia’s Delta NDVI heatmap from March 2024 below. The red areas in the west are areas where March 2024 was dryer than previous years. Green areas in the north-east are areas where March is greener. The deeper the color, the bigger the difference. When looking at the land coverage map on the right, we see that the west is dominated by crop land, whereas the healthiest region in the north east is covered by trees.
The Shiny app
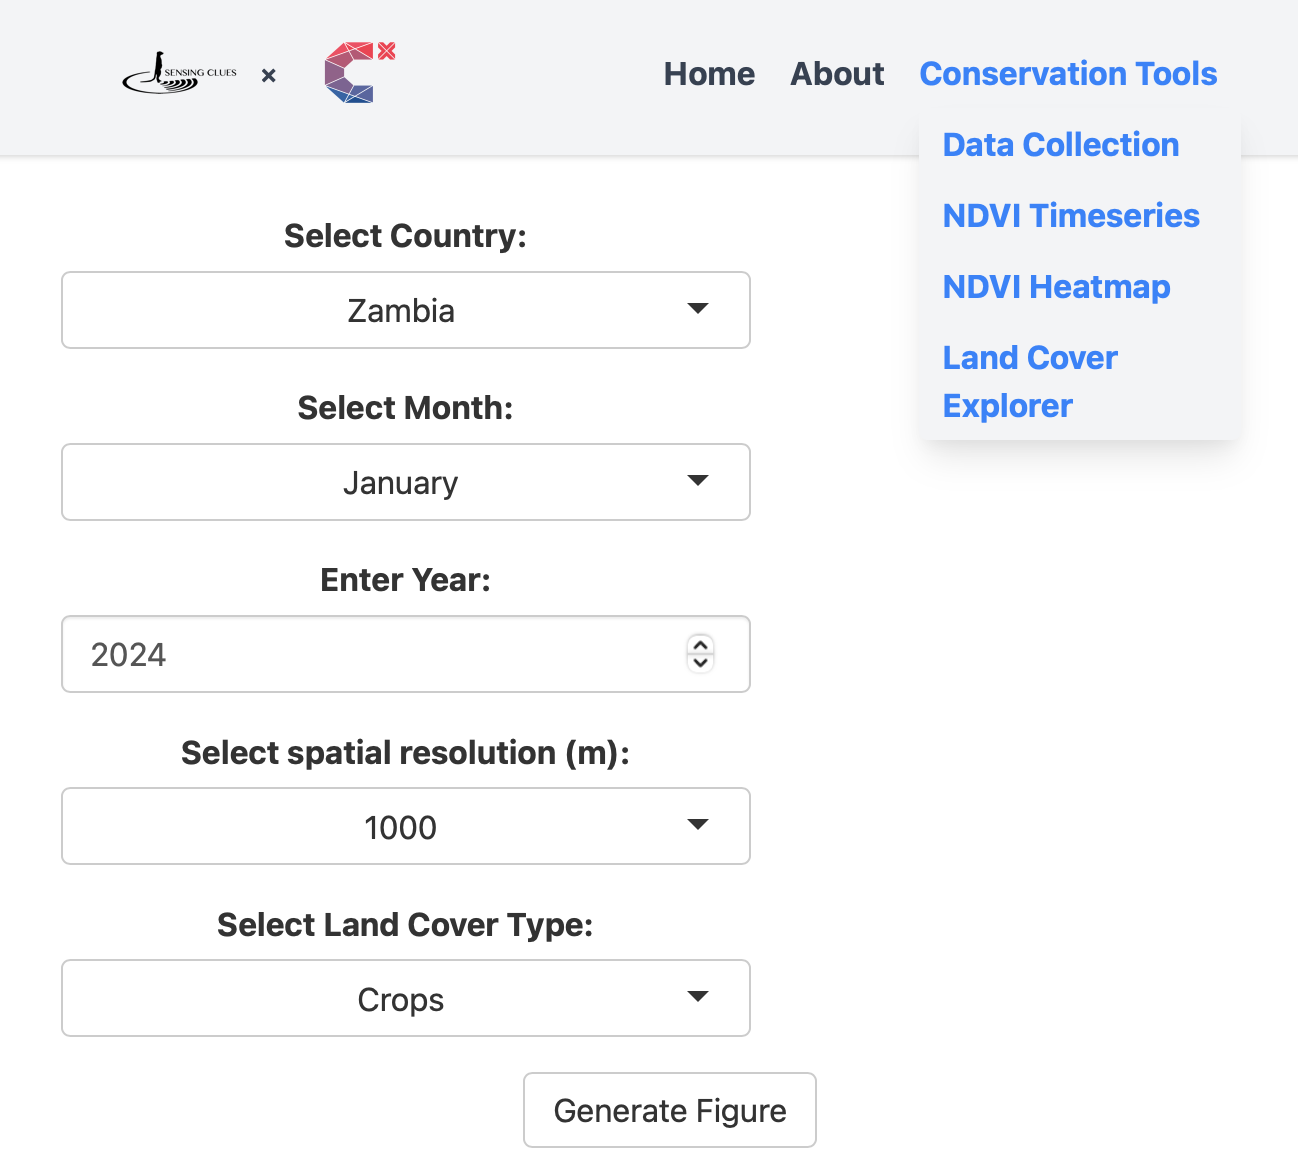
To make this information dynamically accessible to Sensing Clues and their field partners, the team used R and created a Shiny app, deployed from a Docker container.
This allows the field partners to switch between conservation areas, specify months and years of interest, toggle results based on land cover types and set a spatial resolution between 10-1000m of the displayed NDVI. All spatial plots are embedded in zoomable geographic plots that allow to zoom into the regions of interest.
Since computation can be slow when requesting high resolutions, the team also investigated alternative data sources.
Conclusion
The dedicated team of volunteers has put together a handy Shiny app in just five months, giving the Sensing Clues field partners at four conservation sites in Europe and Africa a great tool to keep an eye on vegetation health in their areas. The app provides insights into monthly and seasonal changes in NDVI, as well as details on land coverage. With this information, the field partners now have an additional tool that allows them to take care of and protect the environments they’ve been entrusted with.
The volunteer team and CorrelAidNL would like to thank Sensing Clues for the inspiring collaboration and for the fruitful exchange. We really enjoyed meeting one of the field partners and hearing their enthusiastic response to our project. It was great to make a meaningful contribution! CorrelAidNL would like to thank their wonderful volunteers, who dedicate their time and effort to a good cause, thank you for making a difference!
Volunteers: Everton Lima, Fiona Gallagher, Inês Veríssimo, Mitchell Boer, Davide Alboresi, Maria Bader
Sensing Clues: Melanie Arp, Jan-Kees Schakel, Menno Valkenburg
CorrelAidNL: Mayar Ali
In case you want to experience our events live, follow announcements of future events on Facebook, or Twitter; sign-up for our newsletter; or become part of CorrelAid Netherlands by filling out this short survey. We’d be delighted to see you at a future event!
